
Content originally from Office for National Statistics


Chelmsford’s best score across all subdomains is 114.4 for health relating to “behavioural risk factors”.
“Behavioural risk factors” looks at alcohol misuse, drug misuse, healthy eating, physical activity, sedentary behaviour, sexually transmitted infections, and smoking.
Drug and alcohol misuse are difficult to measure as both can be hidden behaviours. Drug misuse is measured through drug-related crime. For alcohol misuse, we count hospital admissions. A fall in reports of crime or hospital admissions during the pandemic may not represent an actual decrease in alcohol or drug misuse.
The second highest scoring subdomain is “mortality”, while Chelmsford’s worst score is for “physical health conditions”.
Chelmsford’s score for health relating to “mortality” is better than the score for England as a whole
Health Index values for the “mortality” subdomain in England and across local authority areas in the East of England, 2020 and 2021

Health in Chelmsford is strongest among measures relating to the “behavioural risk factors” subdomain
Health Index values for each subdomain, Chelmsford, 2021
100Health in England in 2015Distribution of local authority values in 20212020 value2021 value90100110Physical health conditionsPhysical health conditions101.7101.793.493.4Access to servicesAccess to services95.895.895.895.8CrimeCrime96.496.496.496.4Access to green spaceAccess to green space99.099.099.099.0Personal well-beingPersonal well-being89.689.6102.2102.2Mental healthMental health100.7100.7102.7102.7Protective measuresProtective measures108.8108.8102.9102.9Living conditionsLiving conditions104.6104.6105.9105.9Physiological risk factorsPhysiological risk factors106.7106.7106.9106.9Difficulties in daily lifeDifficulties in daily life118.7118.7110.8110.8Economic and working conditionsEconomic and working conditions114.0114.0112.8112.8MortalityMortality113.1113.1113.0113.0Behavioural risk factorsBehavioural risk factors110.9110.9114.4114.4
Source: Health Index for England from the Office for National Statistics
Chelmsford’s best score across all subdomains is 114.4 for health relating to “behavioural risk factors”.
“Behavioural risk factors” looks at alcohol misuse, drug misuse, healthy eating, physical activity, sedentary behaviour, sexually transmitted infections, and smoking.
Drug and alcohol misuse are difficult to measure as both can be hidden behaviours. Drug misuse is measured through drug-related crime. For alcohol misuse, we count hospital admissions. A fall in reports of crime or hospital admissions during the pandemic may not represent an actual decrease in alcohol or drug misuse.
The second highest scoring subdomain is “mortality”, while Chelmsford’s worst score is for “physical health conditions”.
Chelmsford’s score for health relating to “mortality” is better than the score for England as a whole
Health Index values for the “mortality” subdomain in England and across local authority areas in the East of England, 2020 and 2021
ChelmsfordEnglandOther local authorities in the East of England202190100110120Peterborough: 95.3Luton: 91.1Southend-on-Sea: 96.6Thurrock: 92.3Bedford: 98.1Central Bedfordshire: 107.4Cambridge: 111.2East Cambridgeshire: 113.1Fenland: 94.0Huntingdonshire: 111.8South Cambridgeshire: 121.7Basildon: 98.2Braintree: 104.6Brentwood: 110.1Castle Point: 99.6Colchester: 103.8Epping Forest: 109.1Harlow: 97.7Maldon: 110.8Rochford: 105.2Tendring: 93.0Uttlesford: 120.8Broxbourne: 103.1Dacorum: 109.7Hertsmere: 108.0North Hertfordshire: 109.5Three Rivers: 110.7Watford: 98.6Breckland: 106.8Broadland: 112.0Great Yarmouth: 95.2King’s Lynn and West Norfolk: 97.2North Norfolk: 111.5Norwich: 93.3South Norfolk: 112.3Babergh: 115.3Ipswich: 99.4Mid Suffolk: 114.6St Albans: 117.0Welwyn Hatfield: 107.3East Hertfordshire: 114.3Stevenage: 99.7East Suffolk: 108.5West Suffolk: 111.7Health inEngland in 2015Luton has the lowestvalue of all local authoritiesin the East of England
Source: Health Index for England from the Office for National Statistics
Chelmsford has a Health Index score of 113.0 for “mortality”. The score for the East of England is 105.3, while England has a score of 99.8.
“Mortality” addresses avoidable mortality, infant mortality, life expectancy, and mortality from all causes.
Infant mortality data are based on registrations over a three-year period as numbers in individual areas are low. Death registrations were affected by inquest delays in 2020.
This subdomain’s highest scoring indicator was infant mortality, with an index value of 121.5. The index value for mortality from all causes in Chelmsford is 106.7.

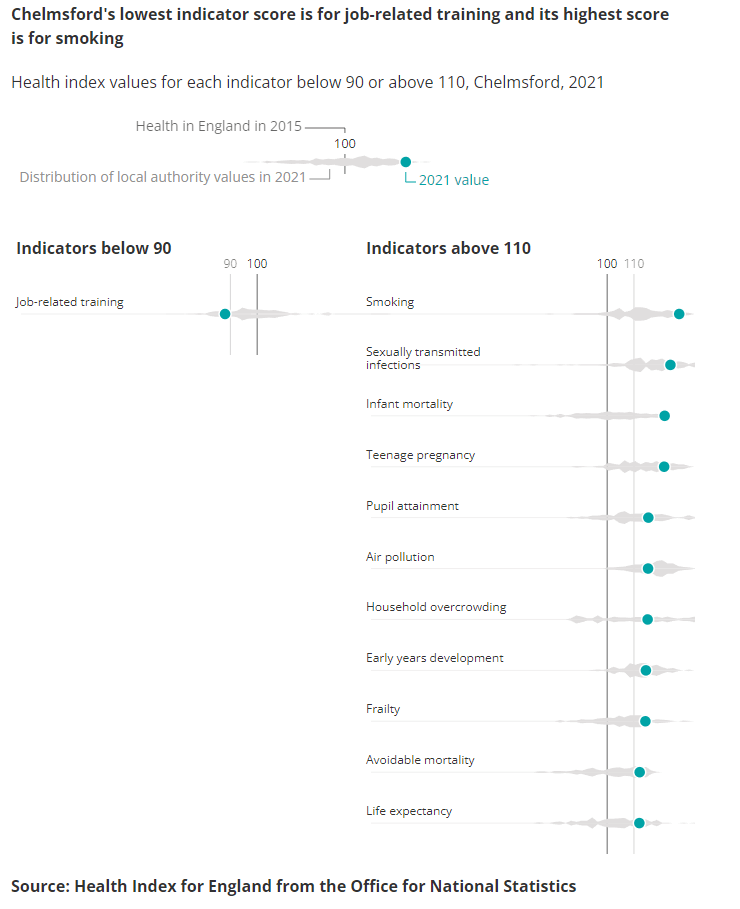
“Economic and working conditions” looks at child poverty, job-related training, unemployment, and workplace safety.
Chelmsford’s score for “economic and working conditions” fell from 114.0 in 2020 to 112.8 in 2021. This means Chelmsford went from being in the top 15% of local authority areas to being in the top 20% across England for this subdomain.
The change was largely because of a worsening in job-related training (a decrease of 10.2) and an increase in unemployment (the index worsened by 1.3 points).
Data for child poverty and workplace safety are from 2019.

“Difficulties in daily life” addresses disability and frailty.
“Frailty” measures hospital admissions as a result of a hip fracture in those aged 65 years and over. Figures may have been affected by higher mortality rates in frailer people during the pandemic, or people being less exposed to injury while less active and staying at home.
Chelmsford’s score for “difficulties in daily life” puts it among the best 20% of local authority areas across England for this subdomain.
Note: Scores of 90 and 110 are one standard deviation away from 100, the average score for England in 2015.
About the data
The topics shown are selected based on rules pre-programmed by Office for National Statistics (ONS) staff, and the text is generated using semi-automated journalism.
This interactive tool is based on data from the Health Index. Since our release in November 2022, some scores for the years 2015 to 2020 have been revised, as described in Health Index methods and development: 2015 to 2021 methodology. This means figures may not match our previous edition of this localised tool.
Please note there may appear to be small inconsistencies in the percentages in this article because of rounding.
You can find out about the measures used in our release on Health Index contents and definitions.

You must be logged in to post a comment.